Introduction: Understanding Microplastics and Their Environmental Journey
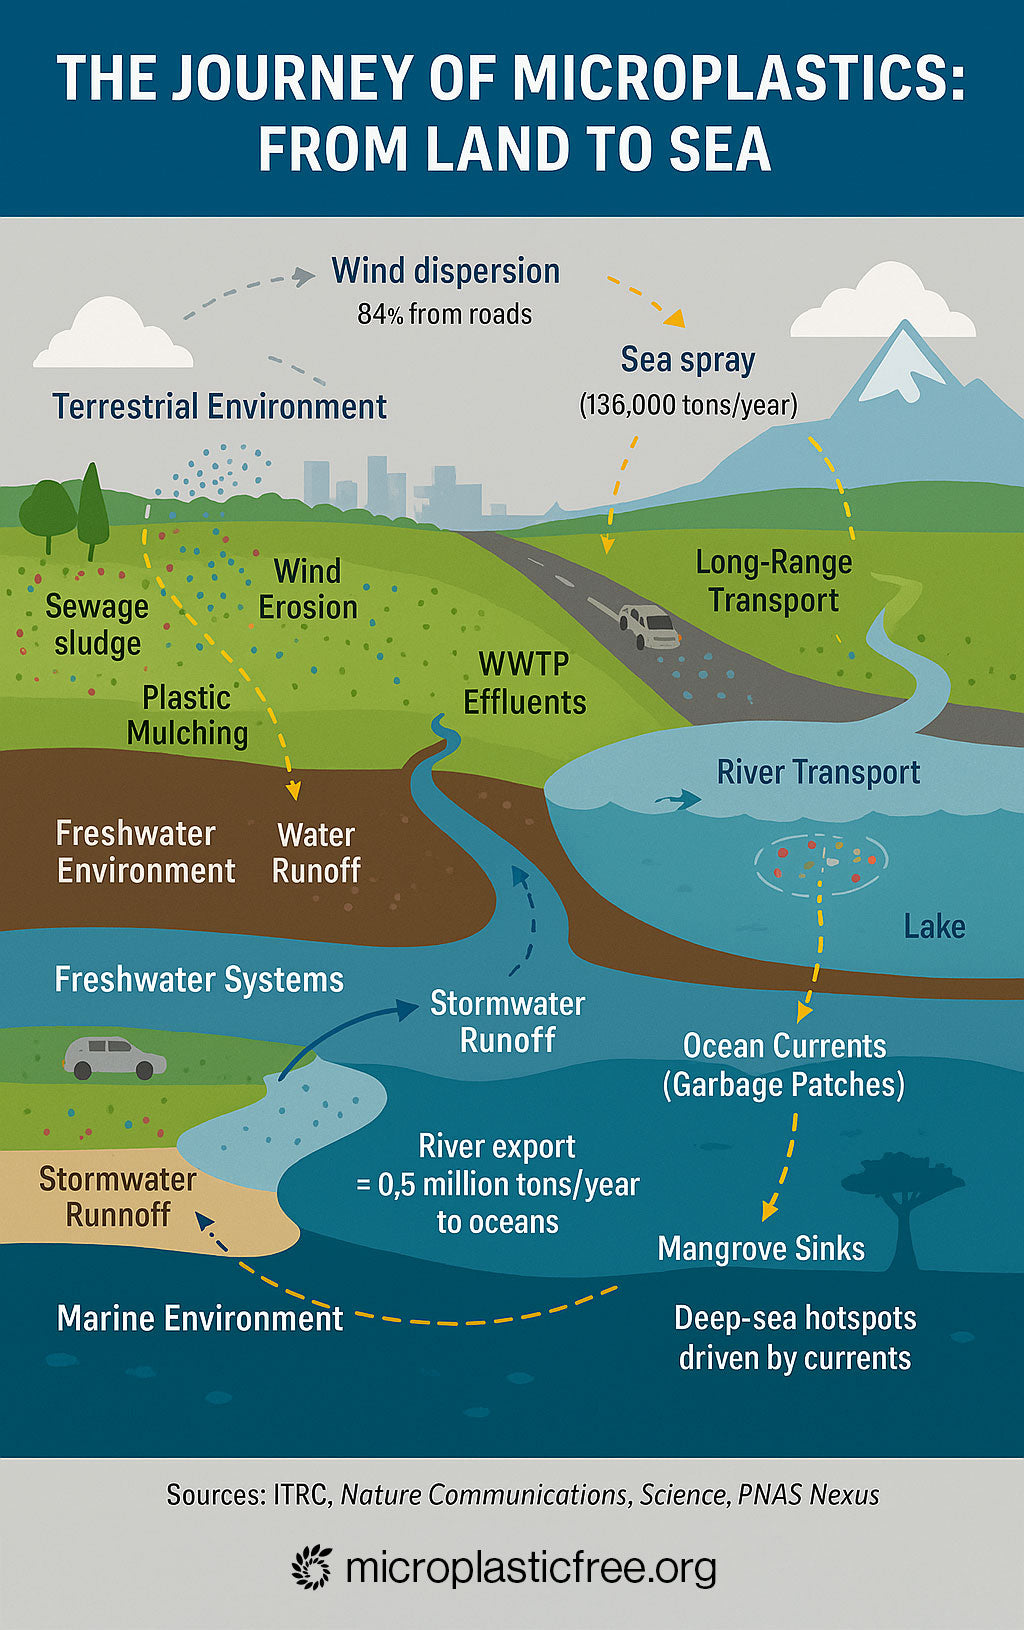
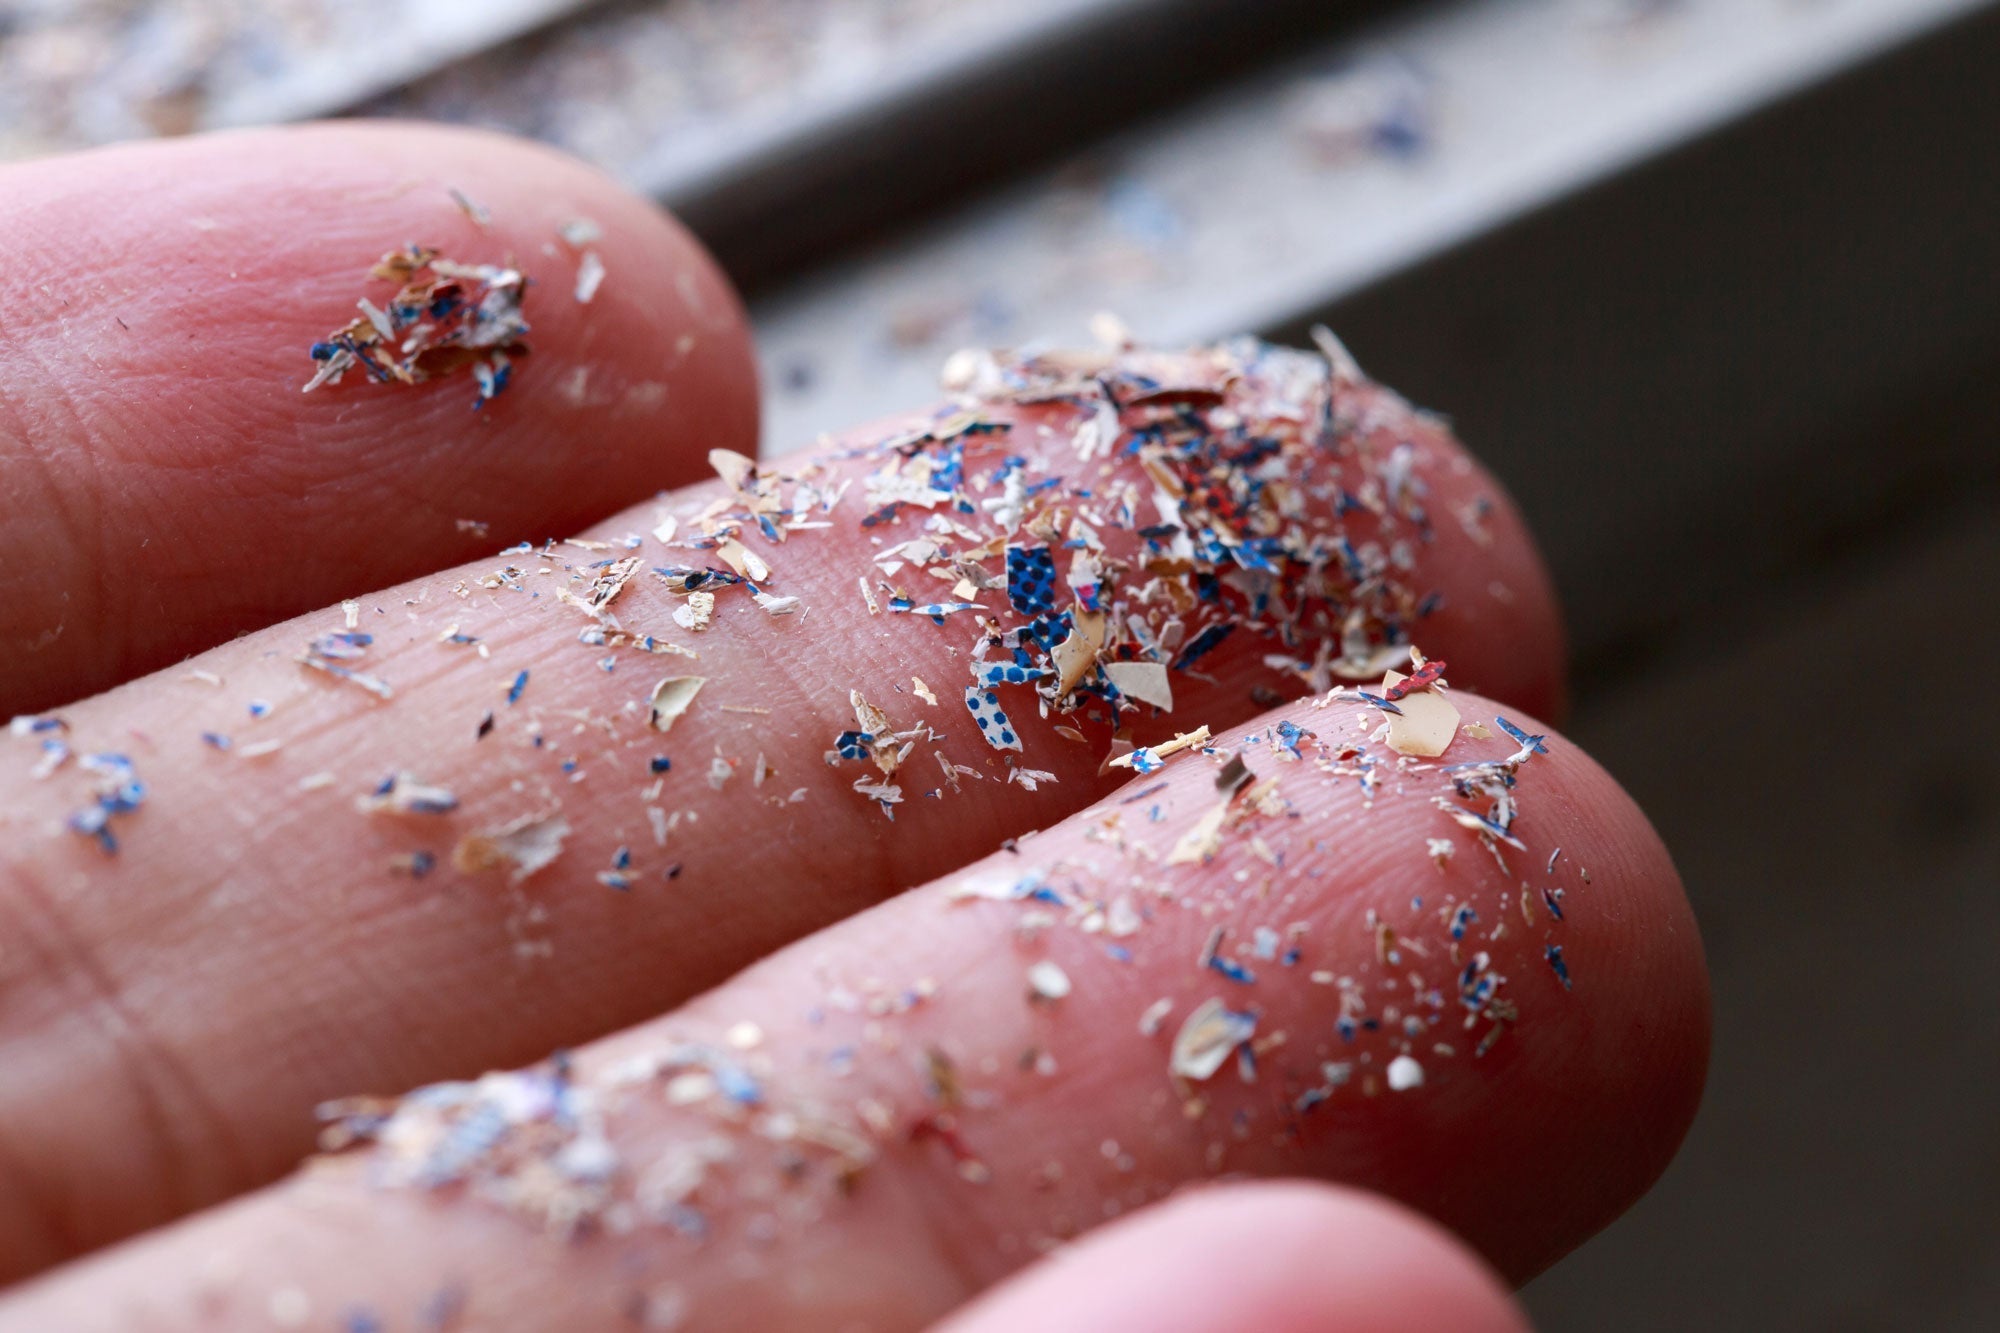
Microplastics, defined as plastic particles less than 5 millimeters (mm) in size, have emerged as a ubiquitous environmental pollutant, infiltrating terrestrial, freshwater, marine, and atmospheric systems. Their small size, coupled with their resistance to degradation, enables them to travel vast distances via wind, water, and ocean currents, ultimately accumulating in diverse ecosystems worldwide. This article delves into the intricate pathways microplastics follow from land to sea, exploring their transport through terrestrial environments, freshwater systems, marine ecosystems, and the atmosphere. Supported by recent scientific research, we outline their global journey, emphasizing key mechanisms such as atmospheric deposition, riverine input, ocean currents, and sedimentation.
Terrestrial Environments: Sources and Transport Mechanisms
Microplastics enter terrestrial environments through multiple sources, including the application of sewage sludge as fertilizer, plastic mulching in agriculture, littering, and atmospheric deposition. A study by the Interstate Technology & Regulatory Council (ITRC) estimates that sewage sludge introduces 125–850 tons of microplastics per million inhabitants annually to European agricultural soils (ITRC, 2025). Plastic mulching, particularly with polyethylene films, is another major contributor, with polyethylene identified as the dominant polymer in agricultural soils (ITRC, 2025).
Once in the soil, microplastics are mobilized through several mechanisms:
- Wind Erosion: In regions with loose or disturbed soil, wind transports microplastics, especially smaller particles, over significant distances.
- Water Runoff: Rainfall events wash microplastics from soil surfaces into adjacent water bodies, contributing to freshwater contamination.
- Biotic Transport: Soil organisms, such as earthworms, ingest microplastics and redistribute them vertically within the soil profile. Studies have shown earthworms moving microplastics deeper into the soil (ITRC, 2025).
Microplastics can also percolate into groundwater, particularly in areas with shallow water tables, where soil moisture and pH influence their mobility. Their presence in soil alters its physical properties—such as water retention and porosity—and disrupts microbial communities. For instance, fibers negatively affect soil aggregate stability, while films reduce water content (ITRC, 2025).
Nonpoint sources, such as stormwater runoff from urban areas, significantly contribute to microplastic pollution. In the San Francisco Bay watersheds, microplastic concentrations in stormwater runoff range from 1.1 to 24.6 particles per liter, underscoring the role of urban environments (ITRC, 2025). Tire wear particles (TWP), derived from synthetic rubber, are particularly abundant near roadways, with elevated concentrations in air, road dust, and soil in high-traffic zones (ITRC, 2025).
Freshwater Systems: Entry Points and Transport Dynamics
Microplastics enter freshwater systems via wastewater treatment plant (WWTP) effluents, stormwater runoff, and direct littering. Although WWTPs remove 72% of microplastics during primary treatment and up to 94% with tertiary treatment, effluents still release substantial quantities. For example, a study reported that WWTPs discharge 141 million microplastic particles per day into the South Saskatchewan River (ITRC, 2025). Stormwater runoff from urban areas transports microplastics to lakes, streams, and bays, with concentrations in San Francisco Bay watersheds ranging from 1.1 to 24.6 particles per liter (ITRC, 2025).
Rivers and streams serve as conduits, carrying microplastics from terrestrial sources to oceans. Their distribution is influenced by streamflow rates, wind, and currents. In contrast, lakes and low-flow areas act as sinks, where sediments trap higher-density microplastics. In colder regions, freeze-thaw cycles drive denser microplastics—like polyethylene terephthalate (PET) and polyvinyl chloride (PVC)—deeper into sediments, heightening groundwater contamination risks (ITRC, 2025).
Microplastics have been detected in groundwater, with concentrations of 15.2 particles per liter of fibers in Illinois and 0.0007 particles per liter in Germany (ITRC, 2025). Bays and estuaries, transitional zones between freshwater and marine environments, show microplastic abundance 4–10 times higher in the water column and 2–3 times higher in sediments compared to other ecosystems, often linked to nearby population centers (ITRC, 2025).
Freshwater biota, including protozoans, invertebrates, and fish, ingest microplastics. A review of 62 global publications found suspension-feeding organisms particularly vulnerable due to their feeding mechanisms (ITRC, 2025).
Marine Environments: Distribution, Currents, and Sedimentation
Rivers are the primary vectors for microplastics from land to sea, exporting an estimated 0.5 million tons of plastics annually, according to the MARINA-Plastics model (Nature Communications, 2023). In the ocean, microplastics are distributed by surface and subsurface currents. Surface currents, driven by wind and Earth’s rotation, concentrate floating microplastics in oceanic gyres, forming garbage patches in the Indian, Atlantic, and Pacific Oceans. Five major garbage patches have been documented (ITRC, 2025).
Subsurface currents, part of thermohaline circulation, transport denser microplastics to deeper waters. A Monterey Bay study found peak concentrations at 200–600 meters, indicating that microplastics penetrate beyond the surface (ITRC, 2025). Sedimentation further accumulates microplastics in deep-sea sediments, which serve as final sinks. A 2020 study reported up to 1.9 million pieces per square meter in seafloor sediments—the highest recorded level (Science, 2020).
Sinking is influenced by particle density and biofouling, where organisms attach to microplastics, increasing their weight and causing buoyant particles to sink (ScienceDirect, 2020). Mangrove ecosystems exhibit 4–10 times higher microplastic concentrations in the water column and 2–3 times higher in sediments, acting as sinks due to their dense root systems (ITRC, 2025).
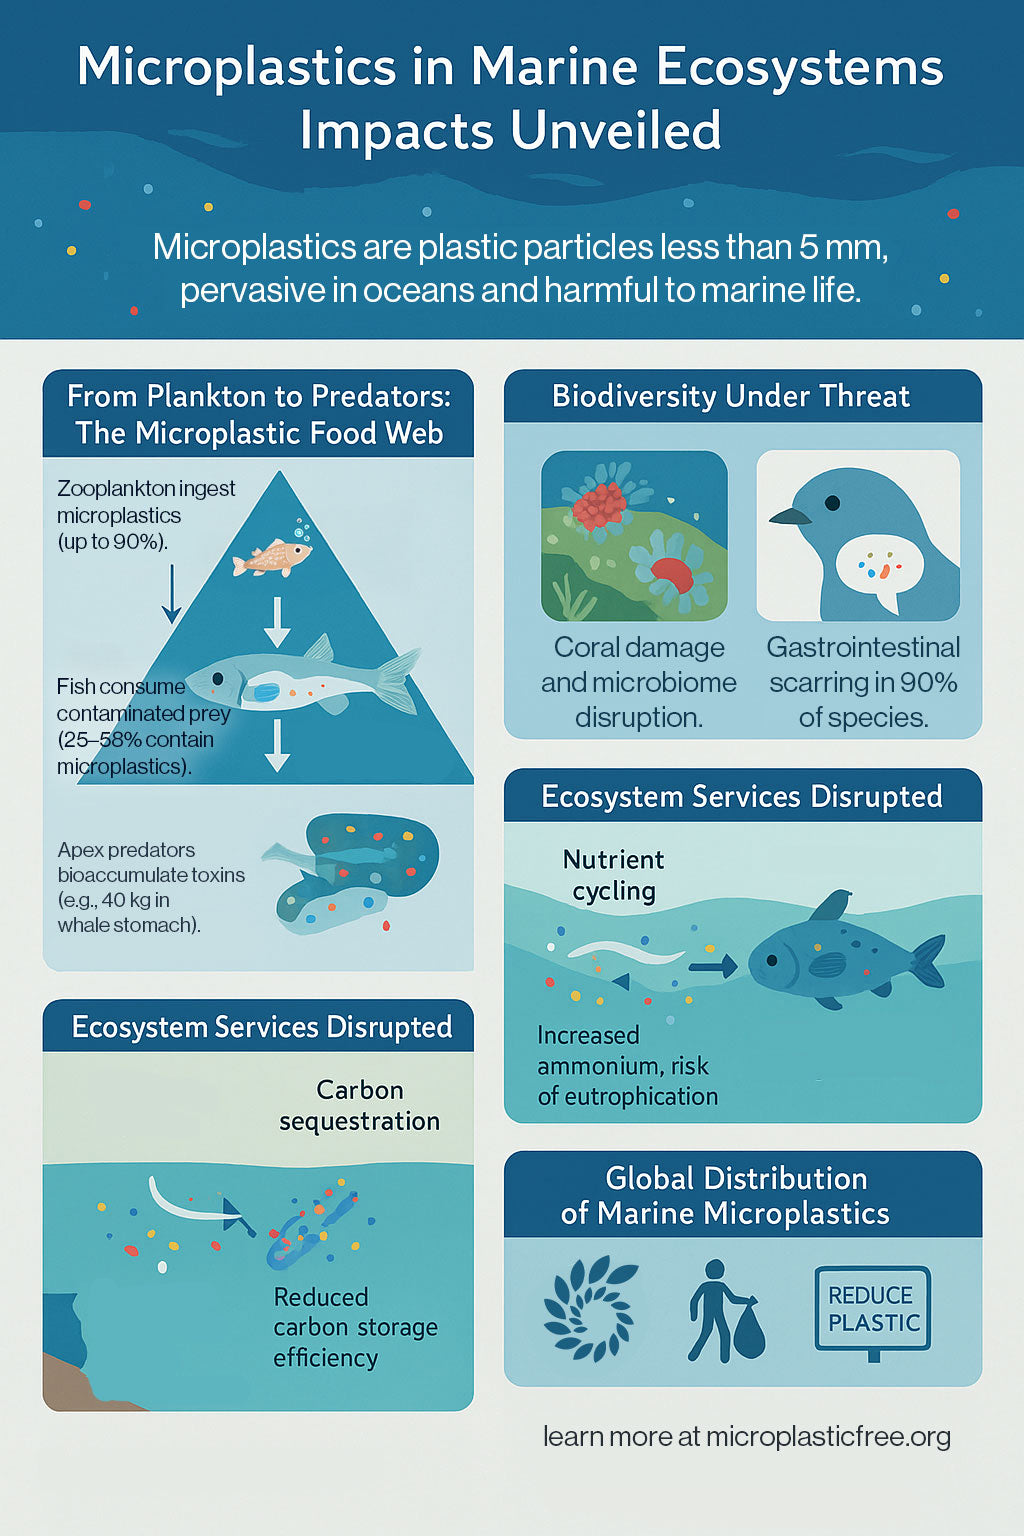
Marine organisms, including crustaceans and mussels, ingest microplastics, potentially leading to bioaccumulation and altered nutrient cycling. For instance, increased ammonium from microplastic ingestion may contribute to eutrophication (ITRC, 2025).
Atmospheric Transport: Dispersion and Deposition
Microplastics enter the atmosphere from sources like synthetic textiles, tire wear, and urban dust, with higher concentrations in populated areas (ITRC, 2025). Wind disperses these particles via mechanisms such as wind speed, up/down drafts, convection lift, and turbulence, often triggered by precipitation events (ITRC, 2025).
Long-range atmospheric transport delivers microplastics to remote regions, such as the Arctic, where they appear in snow and ice. A model for the western United States estimated that 84% of atmospheric microplastic deposition comes from roads, 11% from sea spray, and 5% from agricultural soil dust (PNAS Nexus, 2023). Indoor air also contains microplastics, primarily fibers from building materials and consumer goods (ITRC, 2025).
Along coastlines, convective updrafts from breaking waves eject microplastics into the atmosphere via sea spray, with an estimated 136,000 tons released annually (ITRC, 2025). Atmospheric microplastics include fibers and fragments, with sizes varying by location—smaller in remote areas (<300 µm fibers, <50 µm fragments) and larger in urban areas (200 µm–5,000 µm fibers, most fragments <63 µm) (ITRC, 2025).
Riverine Input: Quantification and Seasonal Variation
Rivers are a vital link in microplastic transport, exporting approximately 0.5 million tons of plastics to seas annually, per the MARINA-Plastics model (Nature Communications, 2023). Microplastics dominate in 40% of river basins in Europe, North America, and Oceania, mainly from sewage effluents, while macroplastics from mismanaged waste prevail in African and Asian basins, home to 80% of the global population (Nature Communications, 2023).
Seasonal variations significantly affect riverine transport, with plastic flow varying up to fivefold annually due to rainfall and river discharge changes. Research on the Saigon River highlighted these fluctuations (Scientific Reports, 2019). Factors like river size, flow rates, and catchment characteristics influence transport dynamics, with urban rivers contributing higher microplastic loads due to population density (Nature Communications, 2017).
Summary Table: Key Transport Mechanisms and Pathways
| Environment | Key Transport Mechanisms | Example Data | Reference |
|---|---|---|---|
| Terrestrial | Wind erosion, water runoff, biotic transport | 125–850 tons MP/million inhabitants/year in Europe | ITRC, 2025 |
| Freshwater | River flow, sedimentation, WWTP effluents | 141 million MP particles/day in South Saskatchewan River | ITRC, 2025 |
| Marine | Ocean currents, sedimentation, biofouling | Up to 1.9 million pieces/m² in seafloor sediments | Science, 2020 |
| Atmospheric | Wind dispersion, sea spray ejection, long-range transport | 136,000 tons/year via sea spray | ITRC, 2025 |
Conclusion: Mapping the Global Journey of Microplastics
The environmental fate and transport of microplastics involve a dynamic interplay of mechanisms across terrestrial, freshwater, marine, and atmospheric environments. Originating in urban and agricultural settings, microplastics are carried by wind, water, and currents, eventually concentrating in oceans and deep-sea sediments. Their ability to cycle between environments—via atmospheric deposition and riverine input—highlights the need for comprehensive management strategies targeting all pathways. As research advances, understanding these dynamics is essential for mitigating microplastic pollution and safeguarding global ecosystems.
References
- ITRC, 2025. Environmental Distribution, Fate, and Transport of Microplastics
- Nature Communications, 2023. River export of macro- and microplastics to seas by sources worldwide
- Science, 2020. Seafloor microplastic hotspots controlled by deep-sea circulation
- PNAS Nexus, 2023. Atmospheric transport model for microplastics in the western US
- Nature Communications, 2017. River plastic emissions to the world’s oceans
- Scientific Reports, 2019. Seasonality of riverine macroplastic transport
- ScienceDirect, 2020. Microplastics in the marine environment: distribution processes


Leave a comment
This site is protected by hCaptcha and the hCaptcha Privacy Policy and Terms of Service apply.